Why are capital gains taxed differently from gambling winnings?

With the notable exception of IPOs and Private Equity purchases, most financial ‘investments’ in the stock market, FOREX market or derivatives market are not truly investing in a company or asset. Second hand transactions (after an IPO or initial offering) are glorified speculation, largely driven not by that asset’s underly performance, but by what other investors will pay for that asset. In this light, there is not much difference between buying a stock on the NYSE and putting money into a slot machine. Why then are most capital gains taxed at the 15% rate, while gambling earnings are taxed at the 25%+ rate?

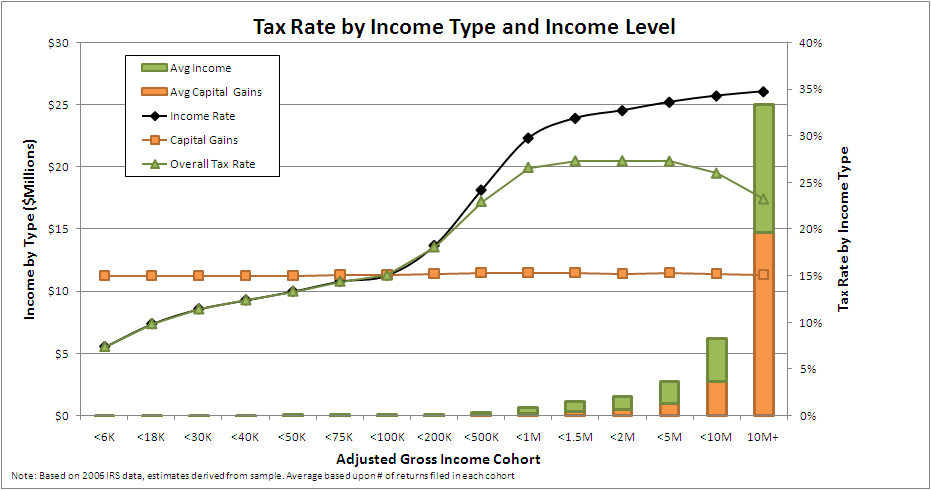
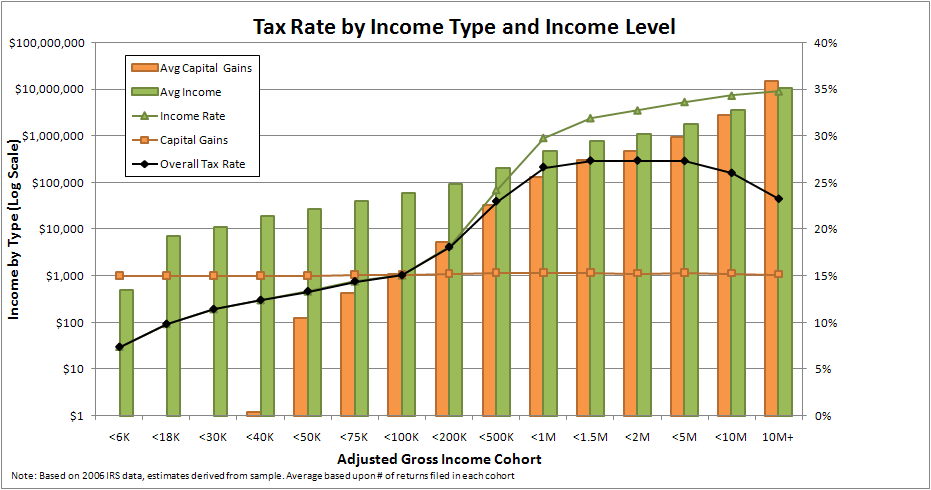
You can draw rhetoric about the ‘double taxation’ of corporations all you want, but the fact is that open market stock purchases have little to no impact on the performance of a corporation unless they issue new stock, which is a very rare occurrence. All of the benefit of stock price fluctuations goes to stockholders, who only face the capital gains tax. We’ve also seen in my earlier analyses on effective tax rates that capital gains are largely a game for the rich, with up to 80% of the upper cohort’s income arriving through this avenue. It’s not a stretch then to say that the only reason capital gains are taxed lower than gambling winnings is that the rich want it that way, and make their opinion known through campaign donations and lobbying efforts.

Effective Tax Rate Across Income Cohorts 2007 Update

I re-ran my prior analysis of effective tax rates across AGI (adjusted gross income) cohorts using updated data from 2007. We see the same trend as in 2006 – the extremely rich pay a lower effective tax rate than the not-quite as rich, due to most of their income coming from capital gains which is taxed at a flat 15% rate. This analysis makes a great case for tax reform – both in higher marginal tax rates for cash income on the rich, and for an rate increase or even rate marginalization on capital gains. Since households have a large degree of flexibility for when they realize capital gains (they aren’t taxed until you close the position), a lifetime marginal rate would be a solid approach. An example would be your first $50k of lifetime capital gains being untaxed, then each $50k after that being taxed at an additional 5% until you reach the cap.

While the results are nearly identical, but it did provide the opportunity to build some new data visualizations. The “average total income and effective tax rate” graph was generated using Think-Cell, and the “% of income by type and associated tax rates” graph was generated using Excel 2007.

Data available at the IRS website here, published as Individual Complete Report (Publication 1304), Table 3.5

Effective Tax Rate Across Income Cohorts

Here is a quick analysis of effective tax rates using official IRS tax data from 2006. I segmenting the population into cohorts based on their AGI (Adjusted Gross Income), then split their earnings and tax burden into regular income and capital gains categories.

These graphs clearly show that higher AGI cohorts receive a significantly bigger portion of their income from capital gains, which are generally taxed at a flat marginal rate of 15%, compared to the top marginal rate of 33% on normal income. This reduces their effective tax rate relative to lower AGI cohorts, distorting the tax burden.

Visualizing the US Military Budget

Here are a few graphs that compare the national military spend in the US with other developed countries. I used several distinct data sources to pull this together so the numbers may not be exact, but they will be close. The main take-away from this analysis is that if the US military spend per capita or as a percentage of  our national budget was at a level comparable to other developed countries, it would save between $500B and $600B annually.